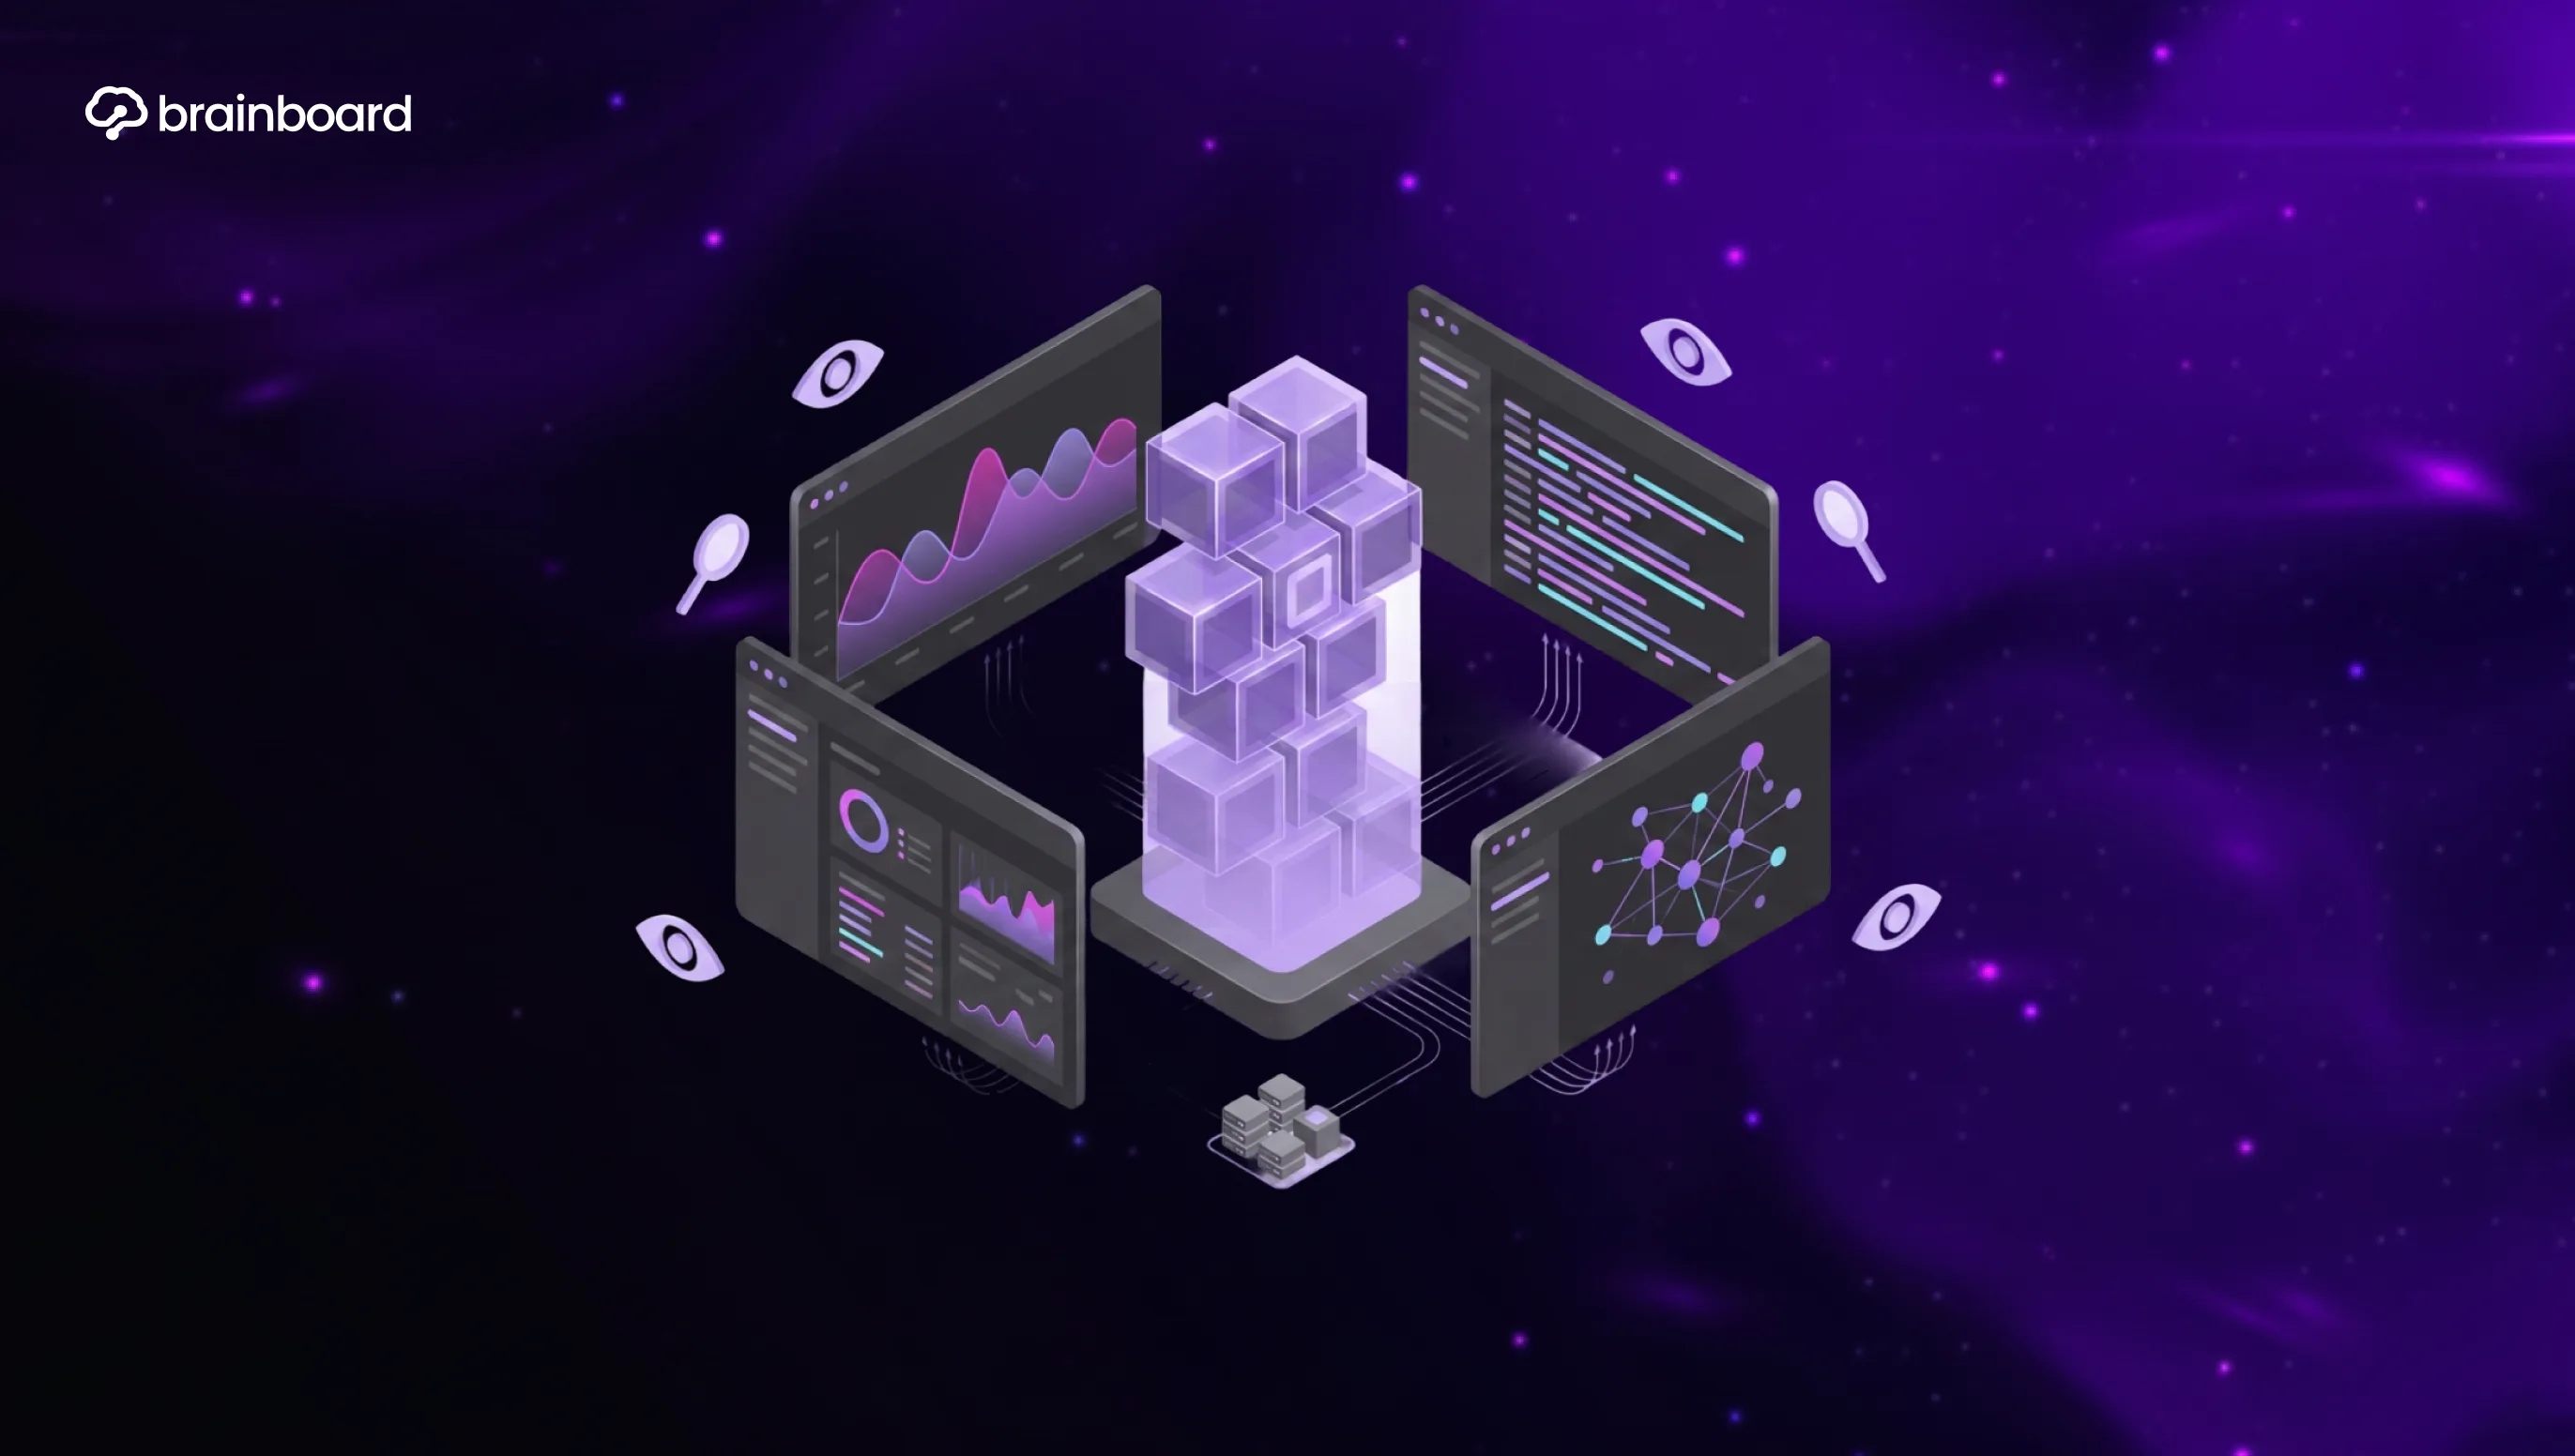
Observability DevOps Tools that Teams Rely on in Production
Chafik Belhaoues
Imagine it’s a Friday, you’re wrapping up your workday and getting ready for a relaxing weekend, but then the unexpected happens… Production goes down. Metrics are in the red, users are complaining, and you have ten minutes to figure out what’s going on. At that moment, it becomes crystal clear whether you have proper observability.
Observability DevOps tools aren’t just about pretty dashboards. They’re about a team’s ability to answer the question “why did it break?” in minutes, not hours. The Brainboard team has been working in this field for many years, and we know exactly what observability means in the context of DevOps. Want to know which tools are actually used in production and how to choose the right one for your situation? Then we’ll help you and answer all the most common questions right now, in this article.
What Observability Means in a DevOps Context
To put it very briefly, monitoring tells you what broke, while observability tells you why.
And the difference here is fundamental. Monitoring is a set of predefined checks: CPU above 90%, a service not responding, and a full disk. You find out about the problem when it’s already there, and only if you happened to anticipate it.
Top observability tools let you ask arbitrary questions of the system in real time - precisely the ones you didn’t foresee during setup. Why is a specific user getting an error? Where exactly in the service chain is the delay occurring? What has changed in the last two hours?
Good observability solutions let you explore the system, not just observe it. For DevOps teams, this means less time spent finding the problem and more time spent solving it.
Metrics, Logs, and Traces: The Three Pillars
Application observability tools are built on three types of signals, and each answers its own question:
- Metrics - numbers over time. CPU, memory, requests per second, and error rate. They clearly show “what” and “when,” but don’t explain “why.” Look at metrics to notice that something is wrong.
- Logs - records of events. Each log entry represents a point in time and an event. They are detailed but can be noisy. When you know where to look, logs provide the exact answer.
- Traces - the path of a single request through the entire system. They show which services the request passed through, how long each step took, and where the delay occurred. They are indispensable in microservice architectures.
DevOps observability tools work well when all three signals are connected: you spot an anomaly in the metrics, dive into the logs, and follow the trace. Three minutes - and it’s clear what happened.
What to Look for When Choosing an Observability Tool
The market for the best observability tools is vast, and choosing one isn’t easy. We recommend focusing first on elements such as:
- Integrations. The tool must work with your stack right now. Kubernetes, cloud providers, languages, and frameworks you use - all of this must be supported out of the box or via ready-made plugins.
- Ease of implementation. If setup takes a week, the team will put it off. Good observability vendors make onboarding fast: install the agent, and the data starts flowing.
- Alerting. Not just “send a notification,” but smart alerts with context. Which service, which host, what changed - without this, an alert at 3 a.m. is useless.
- Scalability. What works for ten services must work for a hundred. Check how the tool behaves as data volume grows.
- Cost. Observability software can be expensive when scaling. Look at the pricing model: per host, per data volume, per user.
Full-Stack Observability Platforms
Some teams prefer a single platform over a set of separate tools. The logic is clear: a unified interface, fewer integrations, and faster correlation between metrics, logs, and traces.
- Datadog. This is one of the best-known options. Metrics, logs, traces, APM, infrastructure maps - all in one place. Expensive, but powerful. Suitable for teams that prioritize speed over cost.
- New Relic. It takes a similar approach with a generous free tier. Works well for teams just starting to build observability.
- Dynatrace. Its strengths lie in automatic dependency detection and AI-driven anomaly analysis. Popular in enterprise environments.
Observability as a service in the form of these platforms reduces operational overhead: you don’t have to set up and maintain the infrastructure for data collection yourself.
Open-Source Observability Tools Worth Running
Open-source data observability tools provide control and flexibility that commercial platforms lack. You only need to pay for the infrastructure.
- Prometheus + Grafana - the classic stack for metrics and dashboards. Prometheus collects and stores metrics, while Grafana visualizes them. A huge community, thousands of ready-made dashboards. The de facto standard for Kubernetes environments.
- OpenTelemetry - not a tool in itself, but an open standard for instrumentation. Once you’ve instrumented an application, data can be sent to any backend.
- Jaeger - open-source tracing from Uber. Integrates well with OpenTelemetry.
- Loki - from the creators of Grafana, log aggregation with minimal storage costs. Convenient to use together with Prometheus and Grafana in a single stack.
The downside of open source is that you have to set it up, configure it, and maintain it yourself. That takes up engineers’ time. On the other hand, there’s no vendor lock-in.
Kubernetes-Specific Observability
Data observability tools for Kubernetes are a whole different story. The dynamic nature of the cluster creates complexities not found in traditional environments.
Pods are recreated, nodes scale, and services move between hosts. Classic “IP-based” monitoring doesn’t work here. You need observability that understands Kubernetes abstractions: pods, namespaces, deployments, and nodes.
Key things to monitor in Kubernetes include pod status and restart reasons, resource usage by namespace and workload, cluster events, service dependencies, and latency between components.
Prometheus with kube-state-metrics and node-exporter covers most of these needs. For tracing between services - Jaeger or Tempo. For logs - Loki or a centralized ELK stack.
When designing cloud infrastructure with Kubernetes, Brainboard helps you visualize the entire architecture and manage it as code, simplifying observability configuration.
Open Source vs Managed: How to Decide
Observability as a service or self-hosted - the choice depends on several factors.
Managed solutions (Datadog, New Relic, Grafana Cloud) deploy quickly, require no operational effort, and scale well. You pay with money, not with engineers’ time. They’re suitable for teams without a dedicated person for observability infrastructure support.
Self-hosted solutions give you full control over your data, eliminate vendor lock-in, and offer predictable costs. But you need people to maintain them. If Prometheus goes down over the weekend, someone has to figure out what happened.
A good rule of thumb: small teams and startups often benefit more from managed solutions. Companies with a strong ops culture and data requirements (compliance, localization) should go with self-hosted.
Observability vendors offer hybrid options: an open-source stack with commercial support. Grafana Enterprise, for example.
Best Practices for Observability in Production
The best observability tools are only half the battle. The other half is knowing how to use them.
- Alerts on symptoms, not causes. An alert for “user errors above 1%” is more important than an alert for “CPU above 80%.” The first indicates a real problem; the second might be normal.
- Fewer alerts, higher quality. Alert fatigue is a real issue. If a team receives 50 alerts a day and ignores half of them, the system isn’t working. The best data observability tools help you set up smart alerting and group and correlate signals.
- Link signals. If a metric shows an anomaly, you should be able to go to the logs for that period and the traces of those requests with a single click.
- Review dashboards regularly. A dashboard that no one looks at isn’t observable. Assign responsible parties and conduct weekly reviews.
- Document runbooks. When an alert triggers, an engineer must know what to do. A link to the runbook directly in the alert significantly reduces response time.
If you want to build an infrastructure with proper observability from the start, Brainboard will help you design and document the architecture, including the monitoring stack.
FAQ
What are the best data observability tools for DevOps teams?
It depends on the stack and budget. Prometheus + Grafana - for open source. Datadog or New Relic - if speed of deployment is important and you’re willing to pay.
What is the difference between monitoring and observability?
Monitoring answers “what broke.” Observability answers “why.” The former reacts to known issues; the latter allows you to investigate unknown ones.
Do I need observability for small projects?
At a basic level - yes. Even a small project needs logs and metrics. A full-stack with tracing is needed when multiple services are involved and manual troubleshooting takes too much time.
Are open-source observability tools good for production?
Yes, if you have the resources for support. Prometheus + Grafana + Loki are used in large production environments around the world. The issue isn’t quality, but operational overhead.
What is observability as a service?
A managed platform where the provider handles the infrastructure for collecting and storing data. You pay and get a ready-to-use tool without having to set it up or maintain it.